.png)

A data-driven case study on what really moves IRR: market scenario, grid constraints, and degradation
This white paper summarizes insights from a modeled 25 MWp PV + 25 MW / 50 MWh Front-of-the-Meter hybrid systems and translates them into investment-relevant conclusions for developers, financiers, and asset owners.
Executive Summary
Co-location is no longer a niche design choice. In European power markets, PV economics are increasingly shaped by midday price cannibalization, more hours with negative prices, and tighter grid access. Adding a battery can convert a single-interconnector PV project into a multi-market, time-shifting asset - but only if the business case is modeled with financing-grade rigor.
The central insight of this paper is that PV+BESS outcomes are no longer primarily driven by installed capacity or a single-year backtest. Instead, they are driven by the market scenario applied over the next 10-15 years, [1] effective grid connection constraints, [2] and cycle and degradation strategies that shape long-term performance. [3]
Key findings from the 25 MWp + 25 MW / 50 MWh case study
- 2024 backtest (multi-market, fully merchant): €7.03m revenue in the analysis period (~€153k per MW) and ~22.1% unlevered IRR, with an estimated asset life of ~15.4 years to 60% SOH (~6,240 cycles).
- Market participation strategy matters: keeping the same technical setup, revenues vary strongly by strategy from ~€2.2m (Day-Ahead only) to ~€7.0m (merchant case).
- Grid export constraints are decisive: a static export reduction of 5 MW (25 -> 20 MW) reduces revenues by ~€1.8m and pushes IRR down to ~13% in the evaluated setup.
- More cycling increases revenue but compresses lifetime: increasing the cycle limit from 1.25 to 2.0 cycles/day adds ~€330k but shortens modeled lifetime by ~5.4 years.
- Figure 1 illustrates how the revenue, unlevered IRR, and effective asset lifetime are determined based on the fully merchant, multi-market dispatch strategy for the PV+BESS hybrid system.
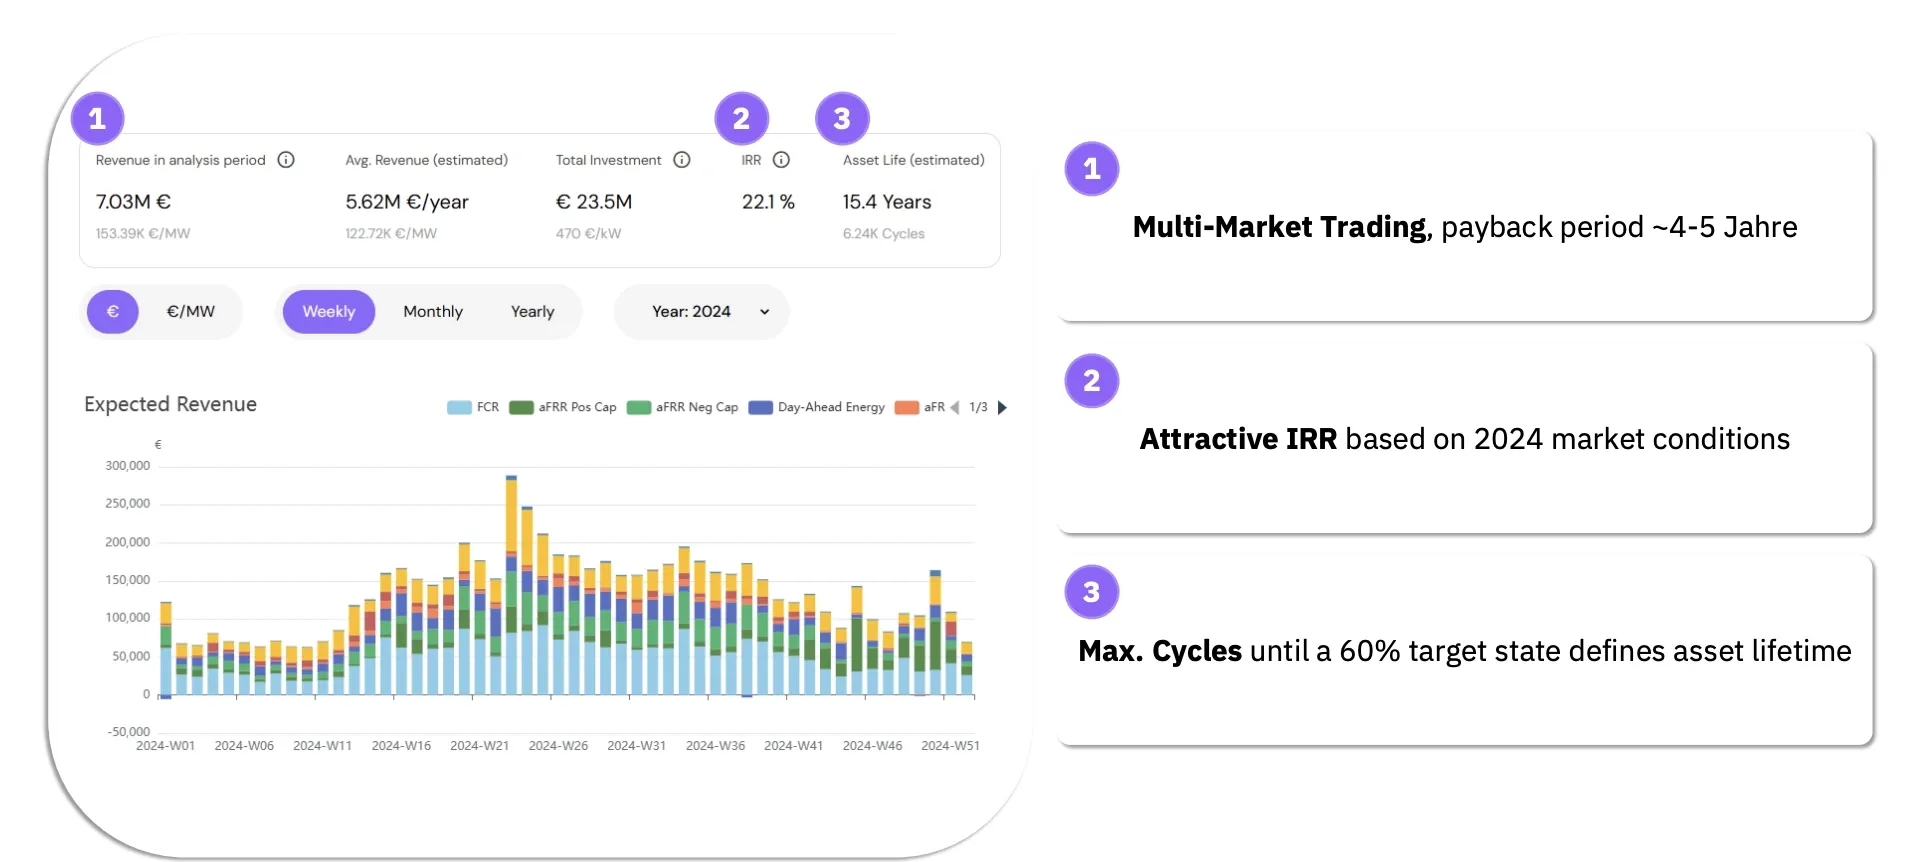
- In short, the figure illustrates the strong short-term returns potential, which can be achieved by virtue of a favorable market, while simultaneously indicating their inherent connection to a dispatch strategy and a cycle-driven lifetime approach.
1. Why PV-only economics are tightening - and why Co-location is rising
In Germany and across Europe, PV-only projects are facing a new combination of pressures: declining and more volatile price levels, uncertainty in PPA pricing, more frequent negative-price events, and increasing bottlenecks around grid connection capacity. These developments materially affect project valuation, financing assumptions, and M&A pricing for PV project rights and operating assets. [2] [3] [4]
Germany-specific signals that make this shift tangible:
- Negative prices are no longer rare. In 2024, Germany recorded 459 hours with negative day-ahead prices. [1]
- For PV plants remunerated under the EEG market premium scheme, support can be suspended during sustained negative day-ahead prices (e.g., a 3-hour rule applies to certain new installations from 2023 onward). This increases capture-price risk for PV-only projects and strengthens the case for flexibility. [3]
- Grid connection access is increasingly described as a bottleneck, while PV project valuation has become more sensitive to merchant risk, PPA levels, and operational assumptions. [4] [5]
In addition, higher PV penetration can compress PV capture prices via the cannibalization effect (prices tend to fall in the same hours when PV output is highest), further tightening standalone PV economics even if average wholesale prices remain stable. [6]
Hybrid PV + BESS responds directly to this environment. Shared infrastructure can reduce complexity around grid access, and the battery can (a) shift PV energy into higher-value hours, (b) monetize intraday volatility, and (c) add ancillary service revenues. In short: the asset moves from being price-taker PV to an actively dispatched portfolio of revenue streams. The implication for developers is practical: a co-located battery is increasingly not an 'add-on' but a way to make a constrained grid connection bankable under merchant exposure.
2. Case study and modelling approach
Germany: 25 MWp PV combined with a 25 MW / 50 MWh lithium-ion battery. The battery is modeled with DoD-dependent degradation and an end-of-life threshold at 60% state of health (SOH). Dispatch is optimized on 15-minute resolution across multiple markets, reflecting PV generation profiles (derived from local weather) and battery behavior.
Baseline operating assumptions include a cycle limit of 1.25 cycles per day in the reference case.
To isolate the impact of the commercial strategy, the same technical solution of PV+BESS is evaluated under different assumptions on the route to market, as in Figure 2:
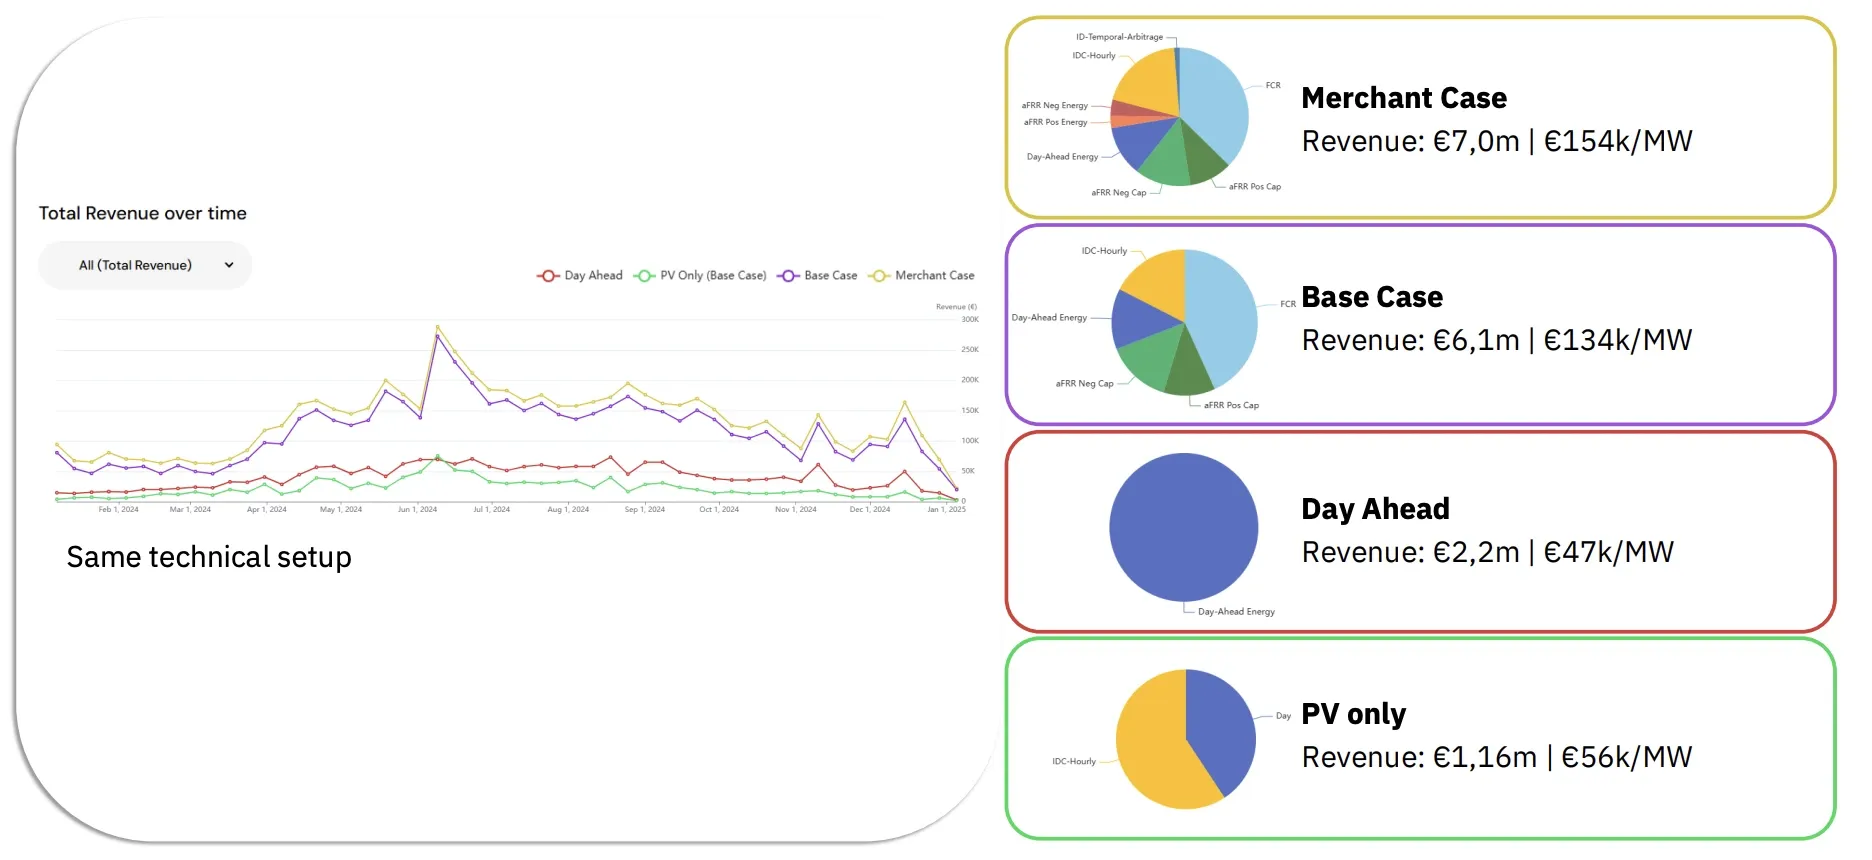
The revenues differ by a few million Euros depending on the market share, and this proves that the commercial strategy is a first-order value driver and not a secondary optimisation decision.
3. 2024 Backtest: Strong Returns are Achievable - but Require Context
When the modeled hybrid is dispatched against real 2024 market data under a multi-market merchant strategy, the asset shows high profitability: €7.03m revenue in the analysis period and ~22.1% unlevered IRR, with an estimated life of ~15.4 years to 60% SOH (~6,240 cycles).
Accordingly, the 2024 backtest should be interpreted as a contextual reference rather than a representative long-term baseline. It shows what is possible in an environment with strong intraday spreads, frequent negative-price windows, and attractive ancillary-service pricing - provided the optimizer can capture opportunities while respecting grid and degradation constraints.
4. Two value drivers that spreadsheets often miss
4.1 Grid constraints: the fastest way to lose IRR
Grid constraints are frequently treated as secondary assumptions in financial models. In practice, they are among the most powerful determinants of realized returns. Any restriction on import or export capacity directly limits the system's ability to monetize peak prices, capture ancillary service revenues, or optimally arbitrage volatility across markets. More broadly, grid constraints and slow grid build-out are increasingly described as a binding bottleneck for the energy transition.
In the analyzed case, a static export limitation of 5 MW (from 25 MW to 20 MW) materially alters the revenue profile. Peak price hours - where a significant share of merchant value is generated - are precisely the periods in which the system is forced to curtail dispatch. As a result, total revenues decline by approximately €1.8 million over the analysis period, pushing the project IRR down to roughly 13%. This represents a reduction of around 9% compared to the unconstrained case.
This illustrates that grid constraints are not an operational detail but a structural system effect. Their impact is non-linear, as they disproportionately affect high-value operating hours. Ignoring them leads to systematically overstated IRRs and non-bankable business cases, particularly for co-located PV+BESS projects operating under merchant exposure.
4.2 Cycling and degradation: higher revenue can shorten the asset
Battery operation is fundamentally a trade-off between short-term revenue maximization and long-term asset value. Increasing the number of daily cycles expands market participation and captures more arbitrage opportunities, but it also accelerates degradation and brings forward end-of-life. In the modeled project, increasing the cycle limit from 1.25 to 2.0 cycles per day results in additional revenues of approximately €330k during the analysis period. However, this comes at a high cost: the modeled asset lifetime is reduced by roughly 5.4 years due to faster depletion of usable cycles.
This shift materially changes the cashflow profile. While annual revenues increase, the total value generated over the asset's life may decline once earlier replacement or augmentation costs are considered. The implication is clear: maximizing cycles is not equivalent to maximizing value.
A frequent modeling simplification is to treat degradation as a linear adjustment. In practice, degradation is strongly influenced by operating conditions such as temperature, state of charge, load profile, and cycling patterns - so cycle strategy directly shapes usable lifetime and the cashflow timeline. [7] [8]
5. Long-term scenarios: the bankable view is structurally lower
Long-term profitability depends most on the scenario applied for future price paths. In this paper, a conservative forecast scenario (15-year horizon) is used as a bankability-oriented view. In the results, this lowers the IRR materially compared to the 2024 backtest.
Using the conservative forecast case integrated in the tool, the modeled project yields ~7.92% unlevered IRR. The forecast explicitly assumes declining revenues in key ancillary-service components (e.g., FCR and aFRR negative capacity) as additional battery capacity enters the market. Revenue outcomes vary by approximately +/-20% across different forecast scenarios.
These dynamics reflect broader market developments rather than project-specific effects. For example, historical balancing market data show that procurement costs and clearing prices can shift materially over time as supply, market design, and participation change. [9] [10]
Although historical backtests demonstrate potential benefits, actual investment decisions rely on future projections, as shown in Figure 3, which provides results based on a conservative 15-year forecast.
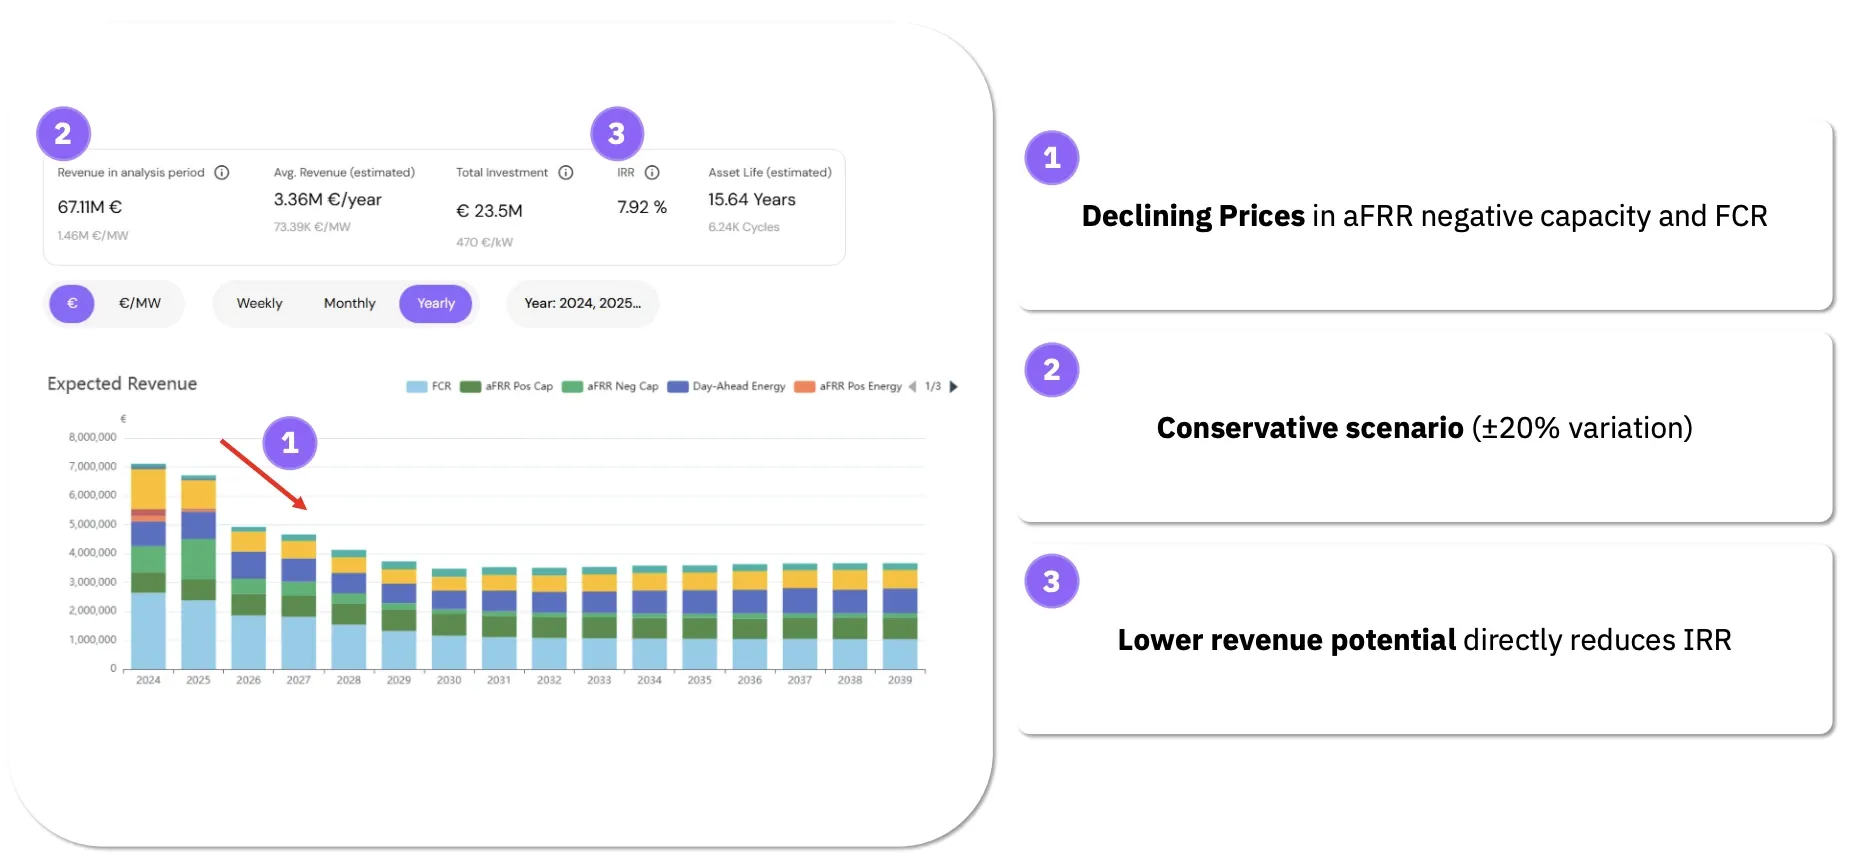
In comparison to the 2024 backtest results, the forecast results provide a clear indication that a structurally lower IRR is not a weakness in the model but a realistic result of the declining ancillary service costs.
A backtest captures the full richness of a historical year: realized volatility, realized spreads, and realized market conditions. Forecasts are, by design, smoother and more conservative; they may also cover only a subset of market products with high confidence. For investment decisions, this is a feature, not a bug: the forecast case should be interpreted as a risk-aware baseline rather than an upside case.
6. Investment Implications: a Practical
For developers and investors, the case study translates into three practical rules:
- Treat the market scenario as a first-class input. Use at least one conservative and one upside scenario, and document the revenue-stack composition.
- Model grid constraints explicitly (export, import, ramps, and time windows) before finalizing sizing. Grid rules can remove multiple IRR points quickly.
- Optimize cycling for lifetime cashflows, not just annual revenue. A cycle strategy that looks attractive on one-year revenue can become value-destructive once replacement needs are priced in.
Common pitfalls observed in PV+BESS modelling include:
- Relying on a single historical year as a proxy for the next 15 years.
- Ignoring export limits or assuming 'nameplate MW' equals dispatchable MW at all times.
- Using fixed-rule dispatch in spreadsheets (e.g., 'charge at noon, discharge at 19:00') without market-by-market optimization.
- Treating degradation as a simple linear haircut instead of a cycle- and DoD-dependent constraint.
Conclusion
PV + BESS co-location can deliver strong profitability - but the difference between a 20%+ backtest IRR and a single-digit long-term IRR is not a rounding error. It is the result of scenario choice, grid constraints, and degradation-aware operation. Projects that quantify these drivers early can size systems correctly, avoid non-bankable assumptions, and negotiate grid and offtake terms from a position of strength.
Overall, the analysis shows that PV+BESS profitability is increasingly shaped by scenario choice, grid conditions, and degradation dynamics. Projects that explicitly account for these interactions can be designed, evaluated, and operated with greater transparency and realism.
To evaluate your own PV+BESS project in minutes, explore Re-Twin’s digital-twin workflow and run scenarios, constraints, and strategies side by side.
References
[1] FfE (2025). German electricity prices on EPEX Spot 2024 (459 hours of negative day-ahead prices in 2024). FfE
[2] FfE (2025). European day-ahead electricity prices in 2024 (volatility increase; record negative-price hours in many countries). FfE
[3] netztransparenz.de (TSO platform). Negative spot market price - overview tables (EEG market premium logic for consecutive negative hours). Netztransparenz+1
[4] IEA (2023). Electricity Grids and Secure Energy Transitions (grids as potential bottleneck; connection constraints). IEA
[5] pv magazine Deutschland (2025). Turbulente Zeiten im Strommarkt… Auswirkungen auf die Bewertung von PV-Projektrechten… (valuation sensitivity, PPA levels, financing conditions, overloaded grid connections). pv magazine Deutschland
[6] Reichenberg, L., Ekholm, T., Boomsma, T. (2023). Revenue and risk of variable renewable electricity investment: The cannibalization effect under high market penetration (Energy). ScienceDirect
[7] Edge, J.S. et al. (2021). Lithium ion battery degradation: what you need to know (stress factors: temperature, SoC, load profile). RSC Publishing
[8] Kirkaldy, N. et al. (2024). Lithium-ion battery degradation: Comprehensive cycle ageing data and analysis for commercial 21700 cells (cycle ageing dataset and analysis). ScienceDirect
[9] FfE (2025). Die Regelreservemärkte in Deutschland im Überblick (historical balancing prices/costs, market developments). FfE
[10] Koubar, M. et al. (2025). Techno-economical assessment of battery storage… (discussion of reduced FCR price levels as a profitability driver in recent years). ScienceDirect

.png)

.png)



%201.svg)
.svg)