Benchmark your BESS with Live Market Data.
Test strategies risk-free & have an independent performance index tailored to your battery.
Try Now.svg)




.png)
.png)
.png)


%201.png)
.svg)



%201.png)

%201.svg)

.png)
Your Asset.
Real Markets.
100% Transparency.
Whether you're validating a business case before operation, benchmark your trader, or pressure-test an acquisition target. Live Benchmarking sets a baseline for you to know what you can expect.
Live Benchmarking simulates your digital twin in live markets and delivers an asset specific benchmark.

Forget static reports. Get live performance data on demand with daily summaries delivered in your inbox or simply integrate into your dashboard via API access.

Run across day-ahead, intraday, FCR, aFRR, and balancing markets simultaneously.

Benchmark multiple assets side-by-side to rank performance and surface underperformers across your portfolio.
From Setup To Live Market Insight In Four Easy Steps.
Configure your asset
Define your assets location, technical configuration & grid constraints to build your digital twin.
Choose your strategy
Select from pre-set strategies or configure your own. Run multiple strategies in parallel.
Simulate live Data
Your digital twin is virtually traded with real market data.
Benchmark & improve
Compare simulated performance against actual results, peer assets, or alternative configurations.
Set up your first simulation in minutes. No commitment, no integration required.
The tools behind every insight.
From performance benchmarking to API integration: Live Benchmarking is designed for all stakeholders.
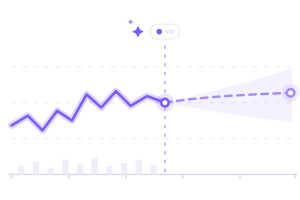
Predict day-ahead and intraday prices using ML models trained on European market data. Forecasts feed into strategy simulation and ground every decision in realistic market expectations.
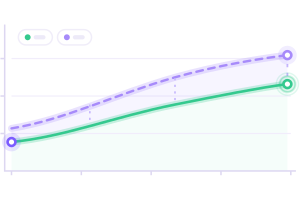
Understand bid success rates, revenue capture efficiency and missed opportunity for your asset.
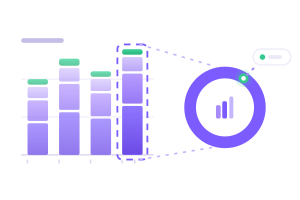
Get detailed revenue breakdowns, trends, battery behaviour & bid insights.

Configure, test, and compare trading strategies in a controlled virtual environment. No code, no spreadsheets.

Daily reports sent to your email and API access for your dashboard is provided.
The Same Platform Insights Tailored To Your Role.
Select your role to see how Live Benchmarking works for your specific decisions.
Stop Guessing.
Start Benchmarking.
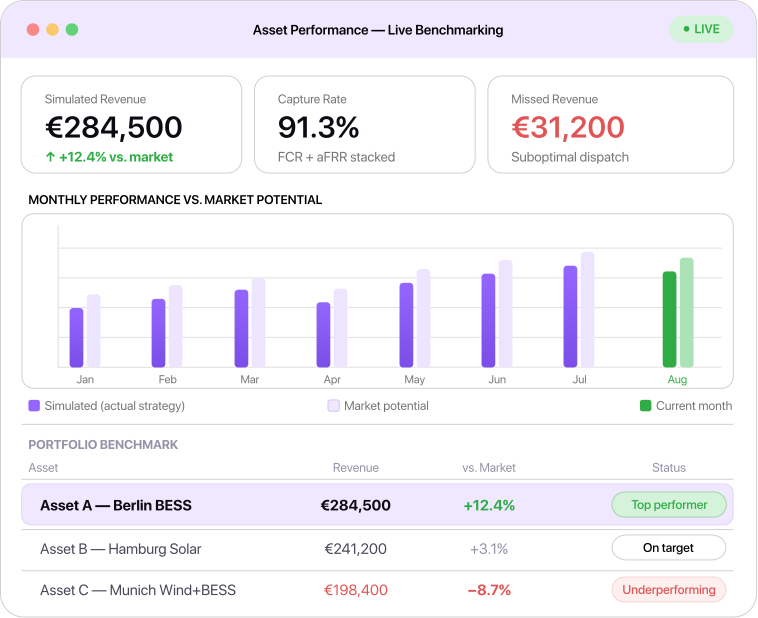
If your asset isn't performing as projected, you need to know why and fast. Live Benchmarking gives asset owners an independent, continuous read on what their asset should be earning versus what it actually is.
- ✓Benchmark each asset against live market yield
- ✓Compare portfolio assets to prioritise attention
- ✓Detect revenue gaps from strategy or operations
- ✓Feed live performance data into your dashboards
- ✓Support O&M partners with independent verification
De-Risk Every Decision.
The investment cycle is full of decisions - each with their own risks. For revenue certainty understanding a project is the foundation.
- ✓Test investments in a virtual environment with live data
- ✓Stress-test assumptions to see if they hold up
- ✓Unify decision-making under one transparent methodology
- ✓Address un-planned developments immediately
- ✓Gain in-depth project understanding through past, present & future datapoints
.png)
Verify Forecasts With Extra Data.
Backtests & Forecasts provide valuable insights, but need extra grounding in live data.
- ✓Verify assumptions with live market data
- ✓Build a bulletproof business case
- ✓Compare different marketing strategies
- ✓Find revenue gaps
- ✓Handover a fully fledged project with a virtual twin
From Concept To Operation. One Platform.
Live Benchmarking works alongside Re-Twin's Investment Analysis module. Together they cover the full asset lifecycle from business case to ongoing performance management.
Investment Analysis
Evaluate projects at the development and acquisition stage. Model revenue, assess risk, and build credible business cases backed by real market data.
PLATFORM
Live Benchmarking
Benchmark performance once assets are operational. Continuously measure what your asset earns vs. what live markets actually offered.
Answers to your questions
Re-Twin is your AI-powered digital twin platform that tells you what your battery project is worth, through site-specific business cases and independent benchmarks.
Re-Twin is a one-stop SaaS platform with four tools: Atlas, Investment Analysis, Live Benchmarking, and Contracting. Built to make battery storage decisions faster, smarter, and more profitable.
AI energy analyst answering setup, analysis and strategy questions on demand.
We support the full asset lifecycle from planning to operation with scenario analysis, trading simulations, and performance benchmarking. Re-Twin answers key questions like:
- Which markets should my battery target?
- How do I balance returns and asset health?
- What profit can I expect from different strategies?
A digital twin is a 1:1 virtual copy of your battery asset (real or planned). It mirrors all changes of your set-up, helping you optimize performance and strategy without risk.
Stakeholders in energy storage (developers, asset owners, and financiers), especially in the battery storage space, use Re-Twin for project planning, strategy testing, and operational performance benchmarking.
We focus on battery energy storage systems (BESS), including stand-alone assets and co-located setups like BESS+PV, BESS+Wind, and BESS+Own Consumption.
It assesses project viability and profitability using historical and forecast data, helping users explore different asset configurations and market strategies before making investment decisions.
Live Benchmarking is a new performance measuring concept, that shines where generic indices fail to capture your assets unique set-up. It’s a live trading simulator where users test and improve strategies in a risk-free environment to balance returns, risks, and asset degradation. Results act as benchmarks for your trader or asset against real outcomes. This can further be applied to validate assumptions and provide third-party verification.
Re-Twin provides historical market data and long-term forecast market data (based on FFE & MAON), trading simulations, market-specific revenue projections, cashflows and scenario results tailored to your asset. This data also incorporates degradation, based on your inputs. Project specific parameters can be set to tailor the output.
The Re-Twin Optimizer itself is trained on various data sources incl. price data for spot & ancillary markets from different countries, weather and much more. This means we are also able to generate a PV Generation Profile based on your chosen location.
Data and results can be exported in CSV, Excel, or PDF formats (based on your use case and plan). Downloads are in 1 hour granularity, PRO users get the additional option to download in 15 min granularity.
The platform currently supports Germany, Belgium, Austria, Netherlands and Spain with expansion to other European markets underway. Interested in bringing Re-Twin to your country? Get in touch! We are always looking for pilot partner’s to expand to new countries.
Sign up with a free account to explore the platform and test its capabilities with 2 free runs in Investment Analysis and a free trial in Live Benchmarking. Reach out via our website or info@re-twin.energy for any questions, custom demos and subscription possibilities.
Yes, we offer onboarding and continuous user support to help you get the most out of the platform. Beyond that, our website's Insights section offers blogs, whitepapers, news, and recordings of past webinars as additional information resources. Also ArTee can answer most of your questions.
Yes. In addition to our six standard forecast scenarios (from conservative to optimistic), you can integrate your own custom scenarios to reflect your specific market assumptions.
The platform is hosted on Microsoft Azure, using its full suite of security tools. It follows GDPR and industry best practices with full encryption and access protection.
Re-Twin unites AI, deep energy expertise, and a user-friendly design to deliver faster insights, smarter strategies, and better financial outcomes in one solution.
Ready To Run Your First Scenario?
Takes 5 minutes to configure. No spreadsheet required.

%201.svg)
.svg)