.png)

A joint publication by Re-Twin Energy and FfE (Forschungsstelle für Energiewirtschaft e.V.)
Executive Summary
This paper is a joint publication by Re-Twin Energy and FfE (Forschungsstelle für Energiewirtschaft e.V.). Re-Twin Energy provides battery storage revenue modelling and optimization, while FfE contributes long-term fundamental electricity price forecasts through its ISAaR energy system model. Together, these two methodologies form the basis for the structural BESS revenue analysis presented in this paper.
Battery Energy Storage Systems (BESS) are typically assessed based on historical backtests that simulate market volatility observed in practice. In 2025, the German wholesale market was characterized by extreme conditions, such as lower renewable generation, thermal plant unavailability, and day-ahead price spikes above €400/MWh, which significantly exaggerated short-term arbitrage returns.[1] Backtests thus simulate the possible outcomes of extreme market volatility, rather than what is feasible in the long term.
Conversely, long-term electricity price projections are based on forward-looking system models that account for the expansion of renewables, electrification, flexibility demand, and system price formation dynamics.[2] As the share of renewables grows, the process of spread formation becomes more representative of system equilibrium than isolated events. However, cannibalization trends at high market penetration levels could potentially reduce structural revenue opportunities.[3]
The difference between backtest performance and forecasted expectations is not a limitation of forecasting. Rather, it is a difference between opportunistic revenue and structural value based on system fundamentals.
Backtests show potential for upside.
Fundamental forecasts establish bankability.
Sound BESS valuation requires anchoring merchant exposure to a structurally consistent baseline aligned with system evolution and flexibility dynamics.[2]
Key Findings
- Backtests can overstate revenue expectations. In recent market environments, revenue can range between €200k to €280k/MW/yr, whereas fundamental forecast-based revenues typically range between €120k to €180k/MW/yr.
- Severe market environments can affect short-term arbitrage opportunities. Low renewable supply, plant outages, and high prices over €400/MWh can create an unstable environment that is unlikely to last in the long term.
- Long-term fundamental price forecasts reflect equilibrium. These forecasts consider renewable supply growth, demand development, fuel costs, and cross-border electricity flows.
- Proper valuation of BESSs involves multiple perspectives. Analytical techniques include historical backtests, fundamental forecasts, and operational simulations.
1. Market Context: The Gap Between Backtests and Forecasts
In electricity markets with high shares of renewable power generation, short-term price volatility is generally higher.[2] This is caused by the weather-related variability of renewable power supply. Additionally, supply-demand imbalances can cause prices to spike. For instance, in the German day-ahead electricity market in 2025, prices above €400/MWh were recorded in September following periods of low renewable power supply. These factors contributed substantially to the widening of intraday and day-ahead spreads, resulting in high arbitrage revenues for storage facilities in particular months. Backtesting, therefore, aims to reproduce historical realized volatility in a specific market environment rather than structural revenues.
Yet, this volatility is not to be considered a structural baseline price. Long-term market evolution needs to be analyzed by system-level modeling of renewable capacity growth, electrification, fuel price evolution, and changing flexibility needs.[2] Structural price formation becomes increasingly driven by system equilibrium instead of isolated scarcity situations.
With increasing levels of renewable penetration in the system, cannibalization effects could further tighten spreads over time as the concentration of generation in similar hours further compresses structural price differentials.[3] The difference between backtest performance and structural model expectations is therefore structural, not methodological.
Therefore, backtests reflect realized volatility under specific historical market conditions, whereas long-term forecasts aim to estimate structurally consistent revenue levels under evolving system fundamentals.
2. Re-Twin Methodology for Estimating Long-Term BESS Revenues
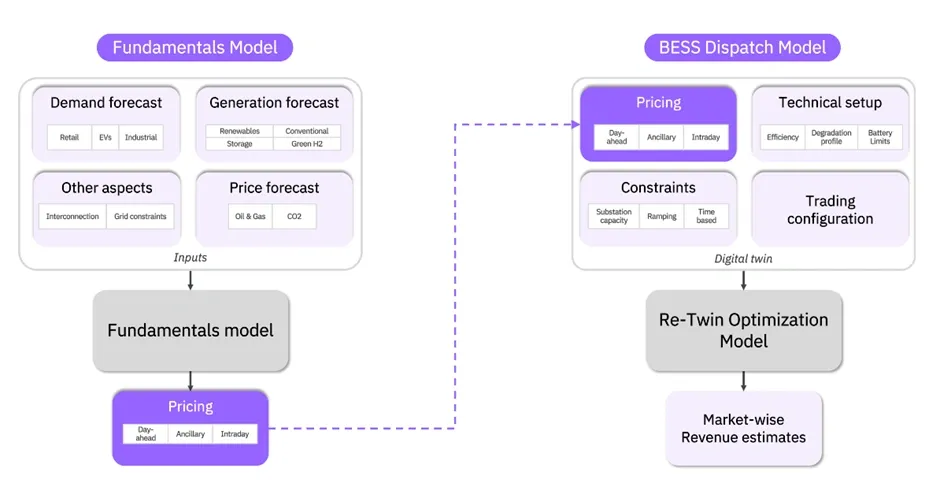
To estimate long-term revenues of BESS, it is necessary to combine forecasts of electricity price with asset-level operational modelling. At Re-Twin Energy, this is carried out through the combination of fundamental electricity market forecasts and battery dispatch optimization modelling.
The first part is based on a fundamental energy system model, which is used to forecast long-term electricity price projections. The forecasts are based on projections of future changes in electricity demand, renewable generation capacities, fuel prices, grid constraints, and cross-border flows. The model is based on hourly market-clearing simulations under various transformation scenarios and is able to provide long-term price forecasts for multiple electricity markets.
The second part is based on a battery dispatch model, which is based on the technical characteristics and constraints of a battery storage system. This includes battery efficiency, battery degradation, and capacity constraints, as well as the market participation strategy.
These forecasted electricity price values are then input into the dispatch model. The optimization model will calculate how the battery can operate in various markets to maximize revenues under the given constraints.
This approach can be used to estimate market-wise revenue potentials of battery storage systems under electricity market conditions. The approach can be applied to evaluate revenue potentials considering long-term scenarios and system fundamentals as well as asset-specific constraints.
3. How Fundamental Forecasts Are Constructed
The basis for long-term electricity price projections is established through fundamental multi-sector energy system models, which simulate the hourly market clearing over a long-term time horizon. In contrast to backtests, which are based on realized historical market conditions, fundamental forecasts seek to capture how the electricity system is expected to develop according to specified transformation scenarios.
The modelling approach considers the interaction of several different components of the energy system, such as:
- Electricity demand in the transport, industry, and buildings sectors
- Development of renewable energy capacity (solar and wind)
- Conventional capacity retirement and marginal cost modeling
- Hydrogen electrolysis and sector coupling
- International trade flows
Crucially, the modelling framework distinguishes between various long-term system transformation paths. The electricity price forecasts used in this paper are produced by FfE (Forschungsstelle für Energiewirtschaft e.V.). FfE's ISAaR energy system model simulates how the electricity market evolves over time, taking into account factors such as renewable energy growth, fuel prices, and cross-border electricity flows. Within this framework, scenarios are represented, for example, by the so-called "FFE Trend Scenario," where the implementation of current policies and market developments is continued, and the "FFE Target Scenario," where the pace of the transformation towards climate neutrality is higher. The revenue projections can differ significantly from each other, thus underlining the necessity of using scenarios for valuations rather than relying on single-point forecasts.
Day-ahead prices are calculated using merit-order dispatch models. Intraday prices include stochastic components to account for deviations in renewable forecasts. Balancing capacity prices (such as FCR and aFRR) are modelled based on opportunity costs compared to spot markets. The aim is not to forecast tail events but to provide a structural estimate of market equilibrium under changing system conditions.
This level of modelling detail helps to explain why fundamental forecasts might look smoother compared to backtest results: fundamental forecasts model equilibrium fundamentals rather than stress events.
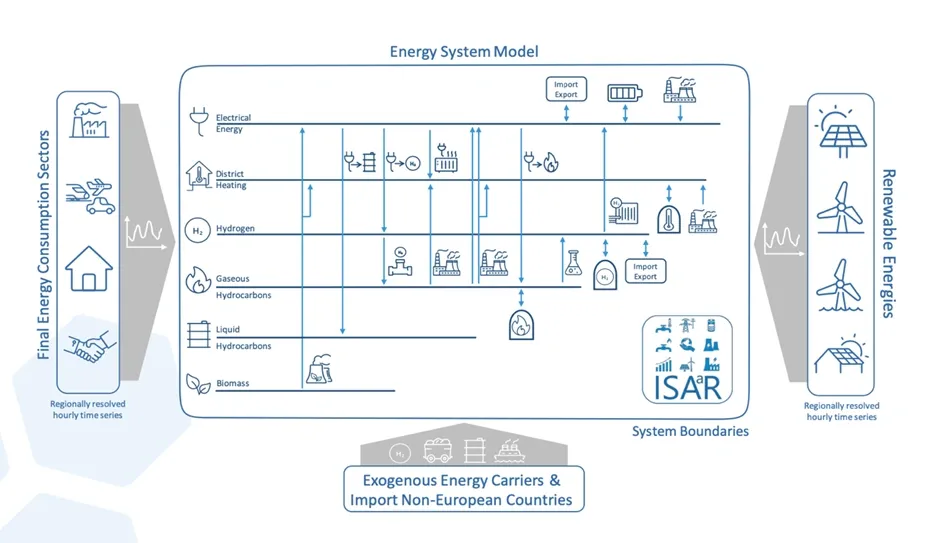
Figure 2 shows the architecture of FfE's ISAaR energy system model, which forms the basis for the structural electricity price forecasts referenced in this paper. This approach helps to identify structural supply-demand dynamics rather than focusing on statistical extrapolation.
The integrated system approach helps to identify structurally derived revenue forecasts that are more suitable for long-term investment than volatility-based backtests.
4. Structural Revenue vs Opportunistic Revenue
BESS revenue can be broken down into two economically different parts: structural revenue and opportunistic revenue. It is important to distinguish between these layers in order to value projects properly.
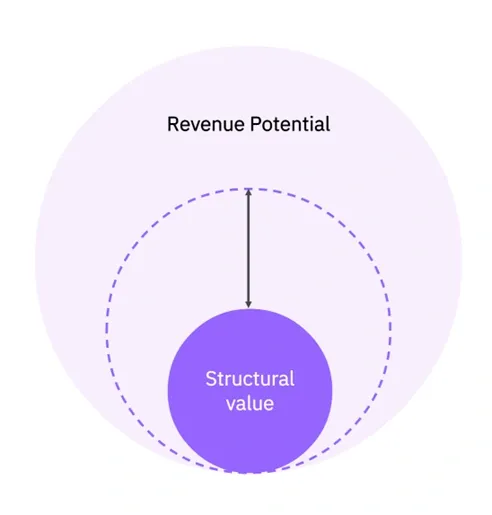
The figure shows the relationship between the structural value and the total revenue potential for the BESS. The structural value shows the stable revenue base, which is obtained from the underlying market conditions. The middle layer shows the realized revenue, which shows the revenue that can be achieved in the market, given market conditions are stable. The area outside the figure shows the revenue potential, which shows the upside potential from the market volatility.
It is important to note that the upside potential, although useful, is not reliable for valuation purposes.
Structural Revenue
Structural revenue reflects the long-term earning potential of a battery storage system under stable, equilibrium market conditions. In simple terms, it is the revenue a battery can reliably expect to earn as the electricity market evolves over time, without depending on unusual spikes or exceptional events. This revenue is influenced by the following factors:
- Revenue embedded in fundamental modelling
- Scenario-based and risk-aware assumptions
- Market dynamics consistent with evolving renewable penetration
- Cashflows relevant for lenders and credit committees (i.e., revenues that banks and project financiers consider when deciding whether to lend money to a project, because they are stable and predictable enough to service debt)
Structural revenue sets the bar for bankability. It is a measure of the sound minimum level of performance under future system development, rather than under exceptional stress conditions.
Opportunistic Revenue
Opportunistic revenue arises from realized volatility and short-term market disruptions. It is:
- Driven by weather deviations and fuel price shocks
- Sensitive to trading strategy and timing
- Dependent on merchant exposure
- Amplified during scarcity events
Although these revenues can contribute significantly to performance in particular years, they are contingent and not structurally durable.
In high renewable systems, cannibalization effects may compress structural spreads over time.[3] Increasing competition in flexibility and wholesale markets further reinforces these trends.[4][5]. This further supports the need to distinguish between upside from volatility and sustainable structurally sound baseline value.
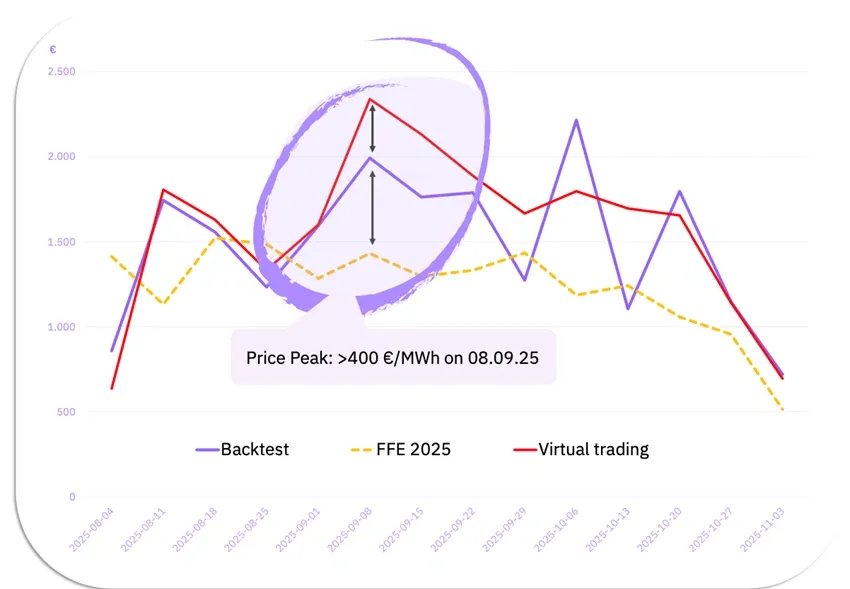
Figure 4 shows the three layers of analysis that are required for the evaluation of revenue risk for BESS. The backtest represents the historical market results that are realized. The fundamental forecast represents the forward-looking results that are based on the assumptions of the system. The live simulation layer represents the forward market signals that are received.
The distinctions between these layers underscore the need for differentiation between structural baseline revenues and volatility-related upside. Thus, strong valuations require synthesizing the three perspectives rather than using any single revenue estimate.
5. Case Illustration: Forecast vs. Backtest Revenues for BESS
The expected revenues generated by the Battery Energy Storage System (BESS) can be obtained either by forecasting prices over the long term or by backtesting the market data. However, the revenues obtained by these two approaches are usually quite different. The revenues obtained by the long-term forecasting method are generally lower, while the revenues obtained by the backtest method are generally higher for the same configuration of the battery.
This does not imply any flaw in the forecasting method. This simply means that the additional revenues obtained in real market conditions are over and above the structural revenues obtained by the long-term forecasting method.
The revenues obtained by the long-term forecasting method are generally the structural revenues of the electricity market. The structural revenues of the electricity market are the result of the spread between the prices in the electricity market, which occurs due to the fundamental factors driving the electricity system, such as the growth of renewable energy, the development of electricity demand, the prices of fuels, and the flow of electricity between borders.
On the other hand, historical backtests provide actual market conditions, which include additional trading opportunities that can occur as a result of short-term volatility, system occurrences, and market conditions. All these can cause an increase in arbitrage trading and hence more realized revenues.
Figure 4 shows this conceptually. The forecast-based revenues for a 2-hour standalone BESS in Germany can vary between €120k and €180k per MW per year, considering only structurally modeled markets. The markets considered here usually include day-ahead markets, intraday hourly trading, and capacity markets from ancillary services.
However, there can be additional revenue streams resulting from additional trading opportunities considered. These can be trading in additional intraday markets, balancing energy markets, and opportunistic trading during unusual market conditions. If these are considered using historical backtests, revenues can increase up to €200k to €280k per MW per year for the same battery configuration.
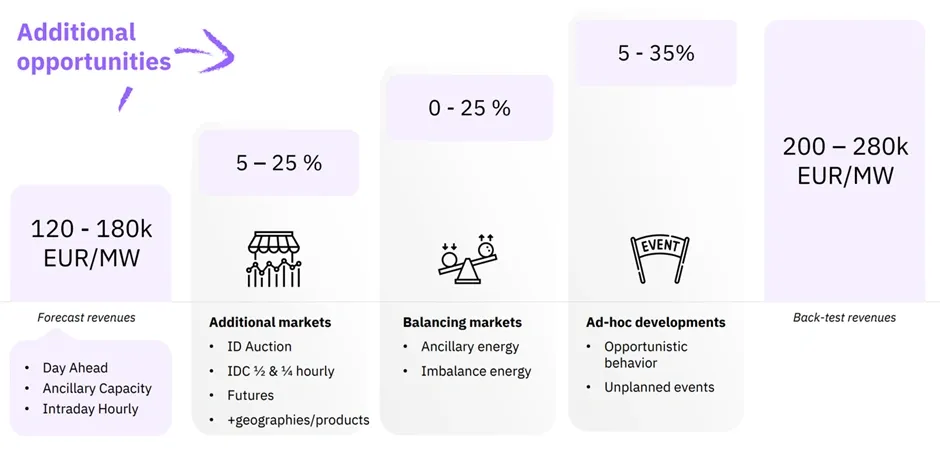
This figure shows how forecast-based structural revenues are used as a baseline to calculate BESS valuations, and additional market opportunities can add to forecast-based revenues in historical backtests.
Additional revenue layers can be derived from:
- Additional market opportunities, which can be derived from intraday auctions, quarter-hourly intraday trading products, futures markets, and cross-border trading opportunities.
- Balancing markets, in which batteries can add additional revenues through ancillary energy and imbalance energy markets.
- Ad-hoc developments, which can be derived from opportunistic trading, market events, and system imbalance.
Figure 4 illustrates this concept by showing how forecast-based revenues represent the structural baseline, while additional revenue layers can emerge from broader market participation and short-term market dynamics.
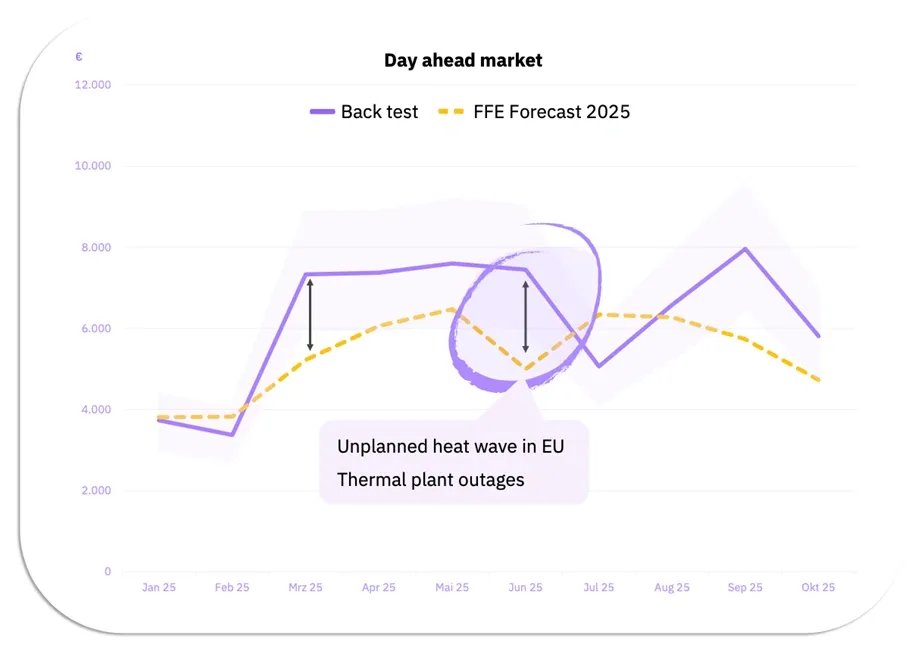
The above figure illustrates forecast-based revenues based on FfE long-term electricity price forecast and historical backtest revenues based on actual market data.
As can be seen from the above figure, forecast-based revenues have a smooth trend throughout the year. This is because forecast-based revenues are based on market spreads, which are derived from long-term energy system model calculations and reflect equilibrium conditions in the electricity market.
On the other hand, backtest revenues vary significantly and have higher peaks compared to forecast-based revenues. This is due to market dynamics, which are hard to forecast in long-term equilibrium calculations.
There are various reasons which can cause this difference between forecast-based and backtest revenues. One reason is weather conditions, which can have a significant impact on renewable energy sources and hence market price spreads. The market and trading strategy can also cause this difference. Sometimes, unexpected technical failures cause power plants to stop producing electricity. These unplanned outages reduce available supply in the market, which can push prices higher and create short-term arbitrage opportunities that a battery can capture. These events are difficult to predict in advance and are therefore not reflected in long-term structural forecasts.
These examples illustrate that long-term forecasts should be understood as an estimate of the underlying revenue potential of battery storage systems. The backtests, on the other hand, are based on actual market outcomes, which can include volatility-driven upside.
What is more, it should be noted that although the revenue figures vary based on battery configuration, market participation strategy, and constraints, the underlying principles can be applied broadly to various battery storage systems.
The examples provided above are intended to illustrate the underlying relationship between forecast revenues and actual market revenues
6. Investment Implications and Market Maturity
As storage resources grow in size, price-maker effects and grid constraints increasingly play a role. For very large BESS systems (e.g., above 500 MW), marginal price impacts, spread compression from self-cannibalization, and dispatch, ramping, or participation constraints could be relevant.
Although many financial models assume price-taker behavior for individual assets, structural modeling approaches consider overall storage penetration and flexibility system dynamics. As market saturation grows, structural spread compression is increasingly likely.
Therefore, robust valuation requires a layered assessment framework:
Structural baseline: Long-term forecast revenues define defensible downside and bankable cashflow expectations grounded in system equilibrium.
Historical Calibration: Backtests validate modelling logic and illustrate exposure to realized volatility.
Strategy Layer: Market participation strategy (pure merchant vs. hedged; single vs. multi-market exposure) determines realized upside and risk-adjusted performance.
A failure to distinguish structural baseline from volatility-driven merchant value can systematically drive up IRR expectations.
With greater storage penetration and market maturity, spread compression and ancillary market saturation will become increasingly likely, while structural flexibility demand will remain a persistent factor. The long-term economics of BESS will thus come to rely more on system design and structural spread creation than on exceptional years of volatility.
7. Conclusion
The difference between backtest revenue of around €280k/MW and structural long-term forecast estimates of roughly €150k/MW is not a forecasting error. It represents the structural difference between volatility-driven upside potential and equilibrium system revenues.
Backtests analyze actual performance for particular market stress scenarios. Long-term forecasts model structurally justifiable revenue based on forward-looking system models. Blending these two aspects results in systematic overestimation of feasible performance.
For capital-intensive BESS projects, bankability is based on structural spread development rather than exceptional volatility years. Opportunistic revenue can improve profitability, but it cannot substitute a structurally sound foundation.
Informed investment choices must therefore ground merchant exposure in a structurally justifiable revenue floor consistent with long-term system development and flexibility needs.
In practice, revenue forecasts must therefore be viewed in the context of their assumptions. Fundamental forecasts offer a consistent approach to assessing value over time, while market participation strategies are critical in assessing the upside potential from volatility and additional trading opportunities.
Investors and developers of projects must therefore balance hedging risks against upside potential in developing a business case for BESS projects. As the market for electricity develops and more storage is added to the market, structural revenue opportunities in multiple markets will be critical to identify.
References
[1] FfE (2025). German electricity prices on the EPEX Spot exchange in 2025. FfE
[2] International Energy Agency (IEA). (2023). Electricity Grids and Secure Energy Transitions. IEA
[3] Reichenberg, L., Ekholm, T., & Boomsma, T. (2023). Revenue and risk of variable renewable electricity investment: The cannibalization effect under high market penetration. Energy. ScienceDirect
[4] ENTSO-E. (2024). Balancing Report 2024. ENTSO-E
[5] ENTSO-E. (2024). Market Report 2024. ENTSO-E

.png)

.png)



%201.svg)
.svg)