Hero

Re-Twin x ECO STOR: Turning Virtual Trading into Custom Benchmarks

Mayur Andulkar
LinkedIn icon
December 17, 2025
6 min
Energy Storage

The Need for a Custom Benchmark

Owning an energy storage asset means navigating a complex and volatile market where every decision counts and often, your performance is in the hands of an external trading partner. While you may trust their expertise, one question remains: how do you define what “good” really looks like?

Traditional performance measures rarely provide the answer. Generic indexes offer a rough comparison but fail to capture the reality of a specific asset. Static models assume perfect foresight and unlimited flexibility ignoring real-world constraints like ramping limits, forecast uncertainty, and market-specific rules that shape daily returns.

For asset owners, this creates a clear need for a custom benchmark: one that mirrors the behavior of their own trading desk and reflects each asset’s location, constraints, market setup, and operational strategy.

How Re-Twin Virtual Trading supports ECO STOR

To bring more clarity to how battery assets are benchmarked and evaluated, Re-Twin Energy partnered with German battery storage developer and asset owner ECO STOR who adopted the Virtual Trading module.

The module simulates how an algo-trader would perform in real markets — bid by bid — providing an independent, data-driven benchmark without taking any financial risk. Each asset receives a live custom benchmark and 7-day revenue forecast, tailored to its configuration and market setup — solving the challenge that no universal index can truly capture.

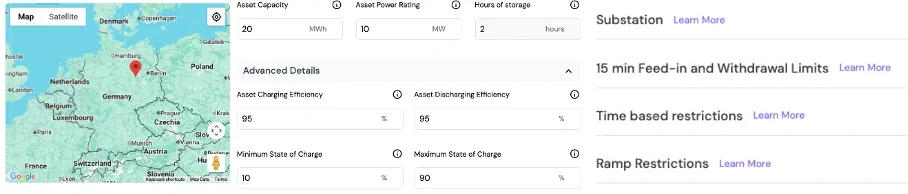
It starts with asset configuration: defining technical parameters like ramping limits, minimum durations, and market timings to reflect real operating behavior.
Graphs and Analytics
Defining asset-specific parameters such as ramping limits, duration, and market timings ensures that simulations reflect real-world operating behavior.

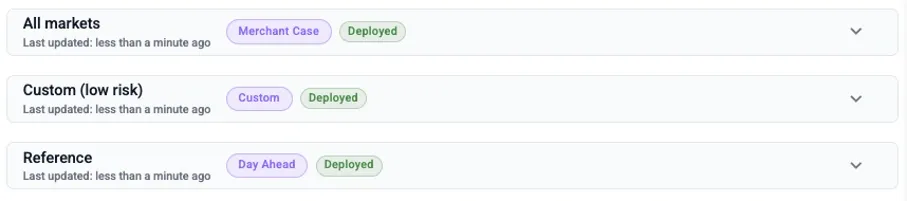
Next, users choose from multiple trading strategies — such as pure day-ahead, fully merchant, or custom hybrids based on their market setup. Each can be simulated and compared side by side, showing how different approaches perform under identical market conditions.
Graphs and Analytics
Multiple trading strategies — from day-ahead to fully merchant — can be configured and compared side by side under identical market conditions.

Once configured, Virtual Trading automatically generates bids using baseline forecasts for all relevant markets — including day-ahead, intraday, FCR, and aFRR.

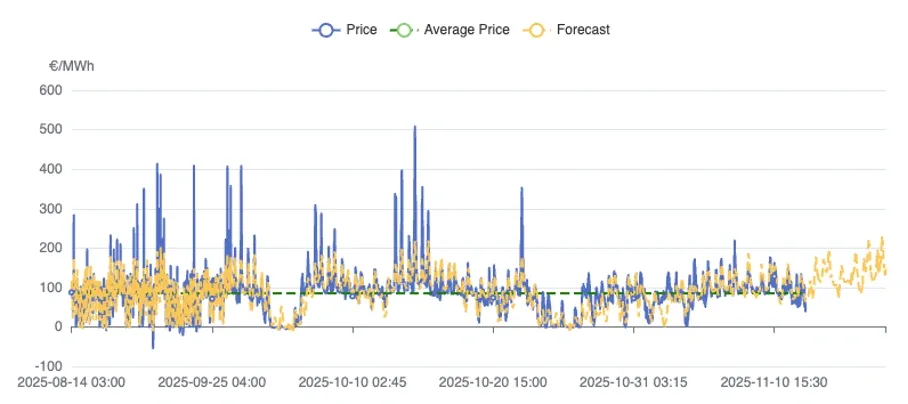
The chart below shows how forecasted and actual day-ahead prices compare, forming the basis for these simulated bids.
Graphs and Analytics
Forecasted and actual day-ahead prices form the basis for simulated bids, creating realistic benchmarks for asset performance.

The next day, the simulated bids are matched against actual market results to calculate revenues from the asset, assess forecast accuracy and benchmark asset performance.

The outcome is a complete trading trace — from forecasts to simulated clearing — showing how an asset would have performed under real market conditions.

At a glance, ECO STOR’s team can track daily results, compare strategies, and see what truly drives performance turning complex market data into clear, actionable insight.

Case Study: Establishing the Performance Floor
Graphs and Analytics
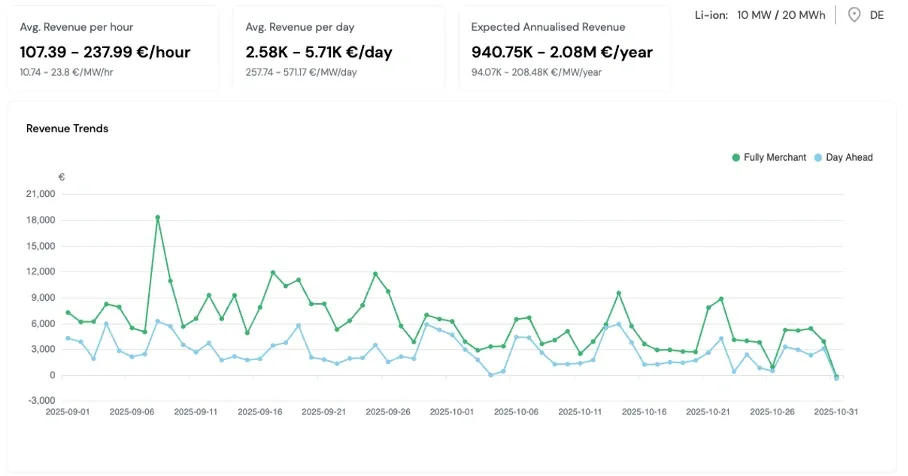
Simulated performance of an exemplary 10 MW / 20 MWh battery asset over two months, comparing a fully merchant strategy (green) with a day-ahead benchmark (blue). The merchant strategy consistently outperformed, defining the asset’s realistic performance floor.

To show how Virtual Trading translates into actionable insights, Re-Twin simulated a 10 MW / 20 MWh BESS operating in the German market. Two strategies were tested under identical technical conditions: a baseline day-ahead approach and a fully merchant strategy designed to capture additional value from intraday and ancillary markets.

The results were clear: the fully merchant strategy (green line) consistently outperformed the day-ahead benchmark (blue line), achieving annualized revenues of €94 k and €210 k per MW respectively.

These findings define a performance floor — a realistic minimum expectation of what a well-optimized asset can achieve in real market conditions. If the actual trading results fall consistently below this floor, it triggers a non-confrontational conversation aimed at optimization, helping both the asset owner and the trader understand why the actual results deviated from the realistic potential.

By comparing simulated and actual results, operators can pinpoint why performance diverged, validate business-case assumptions, and focus on specific improvements that drive higher returns.

Beyond back testing, Virtual Trading also projects 7-day revenue forecast, allowing teams to test new strategies or tweak trading preferences in real time — turning data into a continuous learning loop for performance optimization.

The ECO STOR Edge: Driving Continuous Optimization

The simulations gave ECO STOR a clear and data-backed view of their assets' performance potential. By comparing their actual trading results against these custom virtual benchmarks, ECO STOR gains strategic insights:

  • Aligning Partners: The benchmark serves as a reliable, objective reference for tracking day-to-day performance and evaluating strategic decisions.
  • Identifying Constraints: ECO STOR can identify instances where operational limits (like ramping, timing, or forecast uncertainty) reduced potential revenues.
  • Refining Strategy: This insight becomes the foundation for continuous optimization —fine-tuning the strategy and ensuring the asset's behavior is fully aligned with market realities.

The Roadmap for Future Success

Building on these results, ECO STOR and Re-Twin plan to expand Virtual Trading across more assets, markets, and time periods.

The next step focuses on turning virtual insights into real-world performance testing new strategies, improving forecasts, and integrating benchmark data into automated portfolio optimization.

This approach also strengthens financial reporting, providing investors with transparent, data-backed performance metrics, and supports insurance use cases where validated benchmarks help manage market risk

About The Author

Florian Heise
Mayur Andulkar
LinkedIn icon

Mayur Andulkar is an AI expert with more than 20 published papers and a PhD from BTU Cottbus-Senftenberg. After hands-on roles at Daimler AG and Dow Inc., he led techno-economic optimization at a leading green-hydrogen developer, where the idea for Re-Twin Energy first started taking shape. Driven by solving real-world problems, he has developed award-winning AI systems and digital-factory solutions.

Bereit für intelligentere Investitionsentscheidungen im Bereich Energiespeicher?

Sprechen Sie mit unserem Team. Wir führen Sie in unter 30 Minuten live durch die Analyse eines echten Assets.

Antworten auf Ihre Fragen

Wie lässt sich Re-Twin Energy in einem Satz beschreiben?

Re-Twin ist Ihr KI-gestützter digitaler Energieanalyst zur Bewertung, Simulation und Optimierung von Risiko vs. Rendite für Batterieanlagen.

Was ist die Plattform von Re-Twin Energy?

Re-Twin ist eine One-Stop SaaS Plattform mit verschiedenen Tools: Investmentanalyse und Live Benchmarking. Diese dienen um Entscheidungen im Bereich Batteriespeicher schneller, intelligenter und profitabler zu machen.

Was macht Re-Twin Energy zu einem One-Stop-Shop?

Wir unterstützen den gesamten Lebenszyklus einer Anlage – von der Planung bis zum Betrieb – mit Szenarioanalysen, Handelssimulationen und Performance-Benchmarking. Re-Twin beantwortet zentrale Fragen wie:

- Welche Märkte sollte meine Batterie anvisieren?
- Wie gleiche ich Renditen und den Zustand der Anlage aus?
- Welchen Gewinn kann ich von verschiedenen Strategien erwarten?

Was ist ein digitaler Zwilling?

Ein digitaler Zwilling ist eine 1:1 virtuelle Kopie Ihrer Batterieanlage – ob real oder geplant. Er spiegelt alle Änderungen Ihrer Konfiguration wider und hilft Ihnen, Leistung und Strategie risikofrei zu optimieren.

Wer kann von der Re-Twin Energy Plattform profitieren?

Akteure im Bereich Energiespeicherung (Entwickler, Anlagenbetreiber und Finanzierer), insbesondere im Bereich Batteriespeicher, nutzen Re-Twin für die Projektplanung, Strategietests und das operative Performance-Benchmarking.

Welche Energiespeichersysteme sind enthalten?

Wir konzentrieren uns auf Batterieenergiespeichersysteme (BESS), einschließlich eigenständiger Anlagen und Co-Location-Setups wie BESS+PV, BESS+Wind und BESS+Eigenverbrauch.

Was leistet das Modul Investmentanalyse?

Es bewertet die Machbarkeit und Rentabilität von Projekten mithilfe historischer Daten und Prognosedaten und hilft Nutzern, verschiedene Anlagenkonfigurationen und Marktstrategien zu erkunden, bevor sie Investitionsentscheidungen treffen.

Was ist Live Benchmarking?

Live Benchmarking ist ein neues Konzept zur Leistungsmessung, das dort glänzt, wo generische Indizes die einzigartige Konfiguration Ihrer Anlagen nicht abbilden können. Es ist ein Live-Handelssimulator, in dem Nutzer Strategien in einer risikofreien Umgebung testen und verbessern können. Dabei werden Renditen, Risiken und die Degradation der Anlagen abgewogen. Die Ergebnisse dienen als Benchmarks für Ihren Händler oder Ihre Anlage im Vergleich zu realen Ergebnissen. Dies kann ferner zur Validierung von Annahmen und zur Bereitstellung einer externen Verifizierung genutzt werden.

Welche Art von Daten liefert Re-Twin Energy?

Re-Twin liefert historische Marktdaten und langfristige Prognose-Marktdaten (basierend auf FFE & MAON), Handelssimulationen, marktspezifische Umsatzprognosen, Cashflows und Szenarioergebnisse, die auf Ihr Asset zugeschnitten sind. Diese Daten berücksichtigen auch die Degradation, basierend auf Ihren Eingaben. Projektspezifische Parameter können eingestellt werden, um die Ausgabe anzupassen.

Der Re-Twin Optimizer selbst wird mit verschiedenen Datenquellen trainiert, darunter Preisdaten für Spot- und Regelenergiemärkte aus verschiedenen Ländern, Wetterdaten und vieles mehr. Das bedeutet, dass wir auch ein PV-Erzeugungsprofil basierend auf Ihrem gewählten Standort erstellen können.

In welchem Format sind die Daten herunterladbar?

Daten und Ergebnisse können im CSV-, Excel- oder PDF-Format exportiert werden (basierend auf Ihrem Anwendungsfall und Plan). Downloads erfolgen in 1-Stunden-Granularität, PRO-Benutzer erhalten die zusätzliche Option, in 15-Minuten-Granularität herunterzuladen.

Für welche Länder ist die Plattform verfügbar?

Die Plattform unterstützt derzeit Deutschland, Belgien, Österreich, die Niederlande und Spanien, wobei die Expansion in weitere europäische Märkte im Gange ist. Möchten Sie Re-Twin in Ihr Land bringen? Nehmen Sie Kontakt auf! Wir sind immer auf der Suche nach Pilotpartnern, um in neue Länder zu expandieren.

Wie fange ich an?

Registrieren Sie sich für ein kostenloses Konto, um die Plattform zu erkunden und ihre Funktionen mit 2 kostenlosen Läufen in der Investitionsanalyse und einer kostenlosen Testphase im virtuellen Handel zu testen. Kontaktieren Sie uns über unsere Website oder unter info@re-twin.energy für Fragen, individuelle Demos und Abonnementmöglichkeiten.

Wird Schulung angeboten?

Ja, wir bieten Onboarding und kontinuierlichen Benutzersupport, damit Sie das Beste aus der Plattform herausholen können.

Wie sicher ist die Plattform?

Die Plattform wird auf Microsoft Azure gehostet und nutzt dessen vollständige Suite von Sicherheitstools. Sie entspricht der DSGVO und den Best Practices der Branche mit vollständiger Verschlüsselung und Zugriffsschutz.

Warum Re-Twin Energy wählen?

Re-Twin vereint KI, tiefgreifendes Energie-Know-how und ein benutzerfreundliches Design, um schnellere Erkenntnisse, intelligentere Strategien und bessere finanzielle Ergebnisse zu liefern. Alles in einer Plattform.